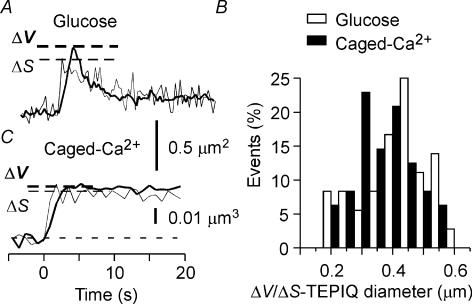
Figure 7. TEPIQ analysis of ΔV/ΔS for exocytosis in pancreatic islets.
A and C, time courses of single exocytic events induced by glucose stimulation (A) or by uncaging of NPE (C). Thick and thin lines are based on fluorescence intensities of SRB and FM1-43, respectively. B, histogram of vesicle diameter obtained by TEPIQ analysis of ΔV/ΔS for glucose stimulation (open bars, n = 36) or for uncaging of NPE (filled bars, n = 48).

