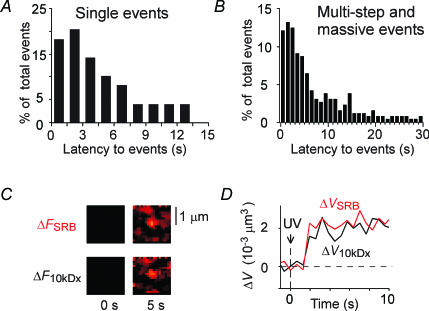
Figure 6. Time courses of LV exocytosis in PC12 cells.
A and B, latency histograms for exocytosis of well-resolved individual LV exocytosis for single (A) and multi-step and massive events (B). C, single exocytic events stained by both SRB and 10 kDa FD. The background-subtracted images for SRB (ΔFSRB) and 10 kDa FD (ΔF10kDax) fluorescence before and 5 s after NPE photolysis are shown. D, time course of ΔV estimated by TEPIQ analysis with SRB (ΔVSRB) and 10 kDa FD (ΔV10kDax).

