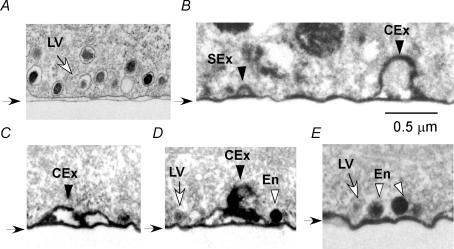
Figure 7. Ultrastructural identification of exocytic and endocytic vesicles in PC12 cells.
Images were obtained at the base of the cells perpendicular to glass coverslips (black arrows). The surface of the glass appeared irregular due to deformation by tissue processing. A, a control cell without stimulation and photoconversion. B–E, cells immersed in FM1-43 for 20 s and stimulated by photolysis of NPE 10 s after the initial exposure to the tracer and fixed 10 s after photolysis. Photoconversion of DAB was induced by FM1-43 molecules remaining after tracer washout. LV and SEx indicate a single LV before and after exocytosis, respectively. CEx represents compound exocytosis by LVs. En denotes direct endocytic vesicles. The external scale bar (0.5 μm) in B applies to all panels.

