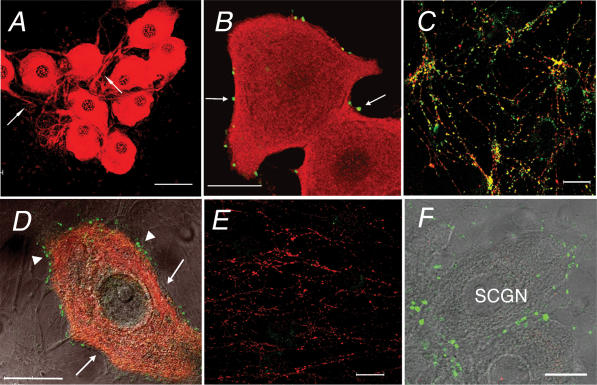
Figure 4. Distribution of myosin Va in cultured SCGNs.
Immunofluorescence of myosin Va in cultured SCGNs prepared from WT (A–E) and dop (F) rats. A, a low magnification image of myosin Va immunostaining. Arrows indicate thick processes of SCGNs. B and C, myosin Va (red) and synaptophysin (green) staining of the soma (B) and long processes (C). Arrows indicate presynaptic sites stained with the anti-synaptophysin antibody in B. No overlap of myosin Va and synaptophysin was observed around the somatic periphery, but overlap (yellow) was present on long processes of SCGNs in C. D, overlay of DIC (greyscale) and immunofluorescence images (red for myosin Va and green for Bassoon). Arrows indicate thin processes that ensheath the soma. Arrowheads indicate presynaptic sites stained with anti-Bassoon antibody. E, myosin Va (red) and Bassoon (green) staining of long processes. No processes stained positively for Bassoon. F, overlay of DIC, myosin Va (red) and synaptophysin (green) staining in a dop SCGN. Sacle bars represent 50 μm in A and 20 μm in B–F.

