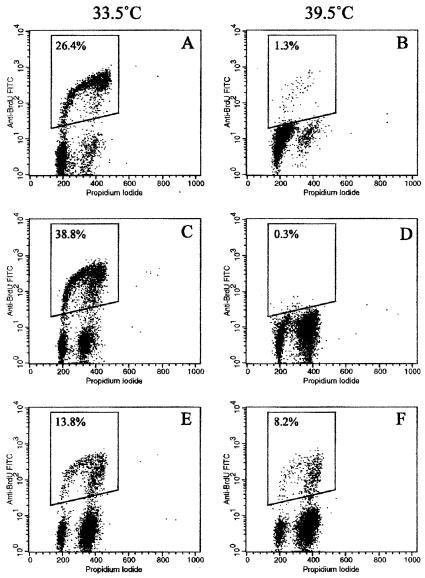
Figure 4.
Cell-cycle analysis. Flow cytograms showing cell-cycle parameters of HMME7 (A and B), HMF3A (C and D), and HMF3B (E and F). Cells were grown at either 33.5°C (A, C, and E) or 39.5°C (B, D, and F) for 5 days and pulse labeled with BrdUrd. Plots show PI fluorescence (x axis) vs. FITC fluorescence from BrdUrd (y axis). The proportion of cells in S phase is shown, being reduced to nearly zero in HMME7 and HMF3A but not HMF3B cells, at 39.5°C.

