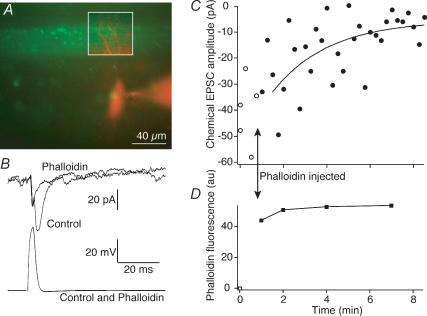
Figure 4. Phalloidin inhibits synaptic transmission.
A, a merged image of presynaptic phalloidin (green) and postsynaptic Alexa 568 (red) showing the region of close apposition between the presynaptic axon and postsynaptic neurone during a paired recording. This region is outlined in the inset box where the contrast of the postsynaptic image was enhanced for clarity. B, postsynaptic responses (EPSCs; top) and presynaptic action potential (bottom) that evoked the EPSCs in the pair shown in the image in A. The responses are shown before (Control) and 8 min after presynaptic injection of phalloidin. Responses are the means of 4 sequential action potentials and EPSCs. C, time course of block of EPSCs (○, control responses; •, after injection of phalloidin). The smooth curve is an exponential fit to the decay of the response (τ= 3.5 min). D, time course of intensity of fluorescence of phalloidin puncta in the boxed region of A. Time course coincident with the electrophysiological data shown in C.

