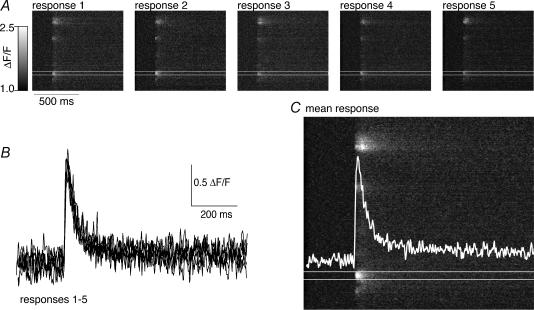
Figure 5. The spatial distribution and dynamic properties of Ca2+ transients are reproducible over repeated stimuli.
A, an axon was retrogradely labelled with Ca2+-sensitive dye (Oregon Green 488 BAPTA-1 dextran). The confocal laser line was scanned for 512 times over the same location at the plasma membrane surface of the axon (see Figs 2, and 6A and B for details) at 500 Hz. The resultant image is a plot of distance along the axon surface in the vertical plane and time in the horizontal axis. A single action potential is evoked leading to a punctate or ‘hotspot’ distribution of Ca2+ entry to the cytosol from along the axon surface. Five sequential responses to single action potentials are displayed. B, integrated plots of the rise in fluorescence taken from the ‘hotspot’ between the white lines in A. The graph is an overlay of all 5 responses demonstrating that the amplitude and rise and decay kinetics of the response is reproducible. C, the image is the mean of the images in A. The overlayed white trace is the mean of the traces in B.

