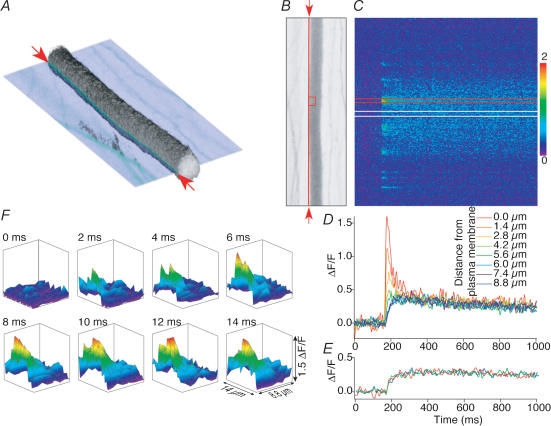
Figure 6. Characterization of action potential-evoked Ca2+ transients in reticulospinal axons.
A, three-dimensional reconstruction of an axon labelled with Oregon Green dextran. The image is reconstructed from 60 sequential optical sections in the live intact spinal cord. Physiological data in the remainder of the figure is taken from line scans at the plane shown cutting through the three-dimensional image. The red arrows indicate the orientation and position of the line scanning performed across the plasma membrane. B, single optical section shown in A orientated orthogonally to the direction of view. The vertical red line between the red arrows indicates the location of the line scanned repeatedly and shown in C. C, line scan of the axon shown in A and B along the line indicated by the arrows at 500 Hz. The laser was scanned repetitively over the same line and the resultant fluorescence trace displayed with time along the x-axis against distance along the axon on the y-axis. A single stimulus was given (arrowhead), leading to transient increase in fluorescence level (i.e. [Ca2+]i). The colour scale refers to ΔF/F. D, at discrete points at the plasma membrane (hotspots) the Ca2+ signal rises and decays rapidly. An integrated plot of a line scan from the part of C between the two red lines; the response recorded at the plasma membrane shown in C is the largest response in red. The smaller slower responses were obtained from line scans positioned sequentially 1.4 μm into the interior of the axon in the order indicated by the colour coding. E, between hotspots, the action-potential-evoked Ca2+ transients rise more slowly. An integrated plot of line scan from the part of C between the two white lines; the response recorded at the plasma membrane shown in C is the same as the response recorded 5.6 and 8.8 μm into the axon interior. F, the data from each line scan summarized for the integrated plots in D were replotted to represent an artificially constructed two-dimensional image of the Ca2+ transient. The colour-coded surface projections each form sequential virtual images of the Ca2+ transients at 2 ms intervals from the red rectangle over the axon in B.

