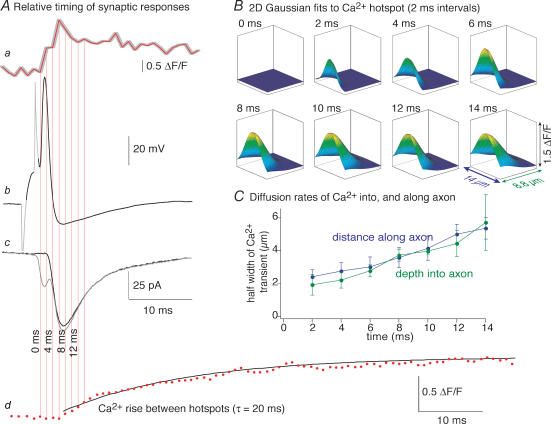
Figure 7. The relative timing of axon Ca2+ transients and the synaptic response.
A, Ca2+ transients at hotspots in the presynaptic axon can account for synaptic release. Aa, Ca2+ transient measured from 4 pixels (1.4 μm), 0 μm from the axon membrane at the hotspot shown in Fig. 5. The grey outline represents the timing uncertainty with respect to the separately recorded synaptic pair in Ab and Ac. Ab, typical action potential evoked with a depolarizing pulse in a reticulospinal axon during paired-cell recording. Sections in grey represent the electrode capacitance transients (dimmed for clarity). Ac, postsynaptic response evoked in this cell recorded as a pair to the action potential in Ab. The grey trace is the average of 10 sequentially evoked synaptic responses. The black trace is the isolated chemical component after subtraction of the electrical component. Ad, Ca2+ transient recorded midway between hotspots (the region between the white lines in Fig. 5C and E). The time base is the same as for Aa–Ac (the y-axis is enlarged for clarity). The black curve is a single exponential fit to the rise of this transient. B, two-dimensional Gaussian fits to the data shown as surface plots in Fig. 5F. These represent an estimate of the spread of the Ca2+ transient at 2 ms intervals. C, four hotspots were analysed from two axons as in B above. The half-widths of the Gaussian fits were plotted with time for 7 frames following the stimulus. Note that the rate of spread of the transient is the same into the interior of the axon as it is along the plane of the axon plasma membrane.

