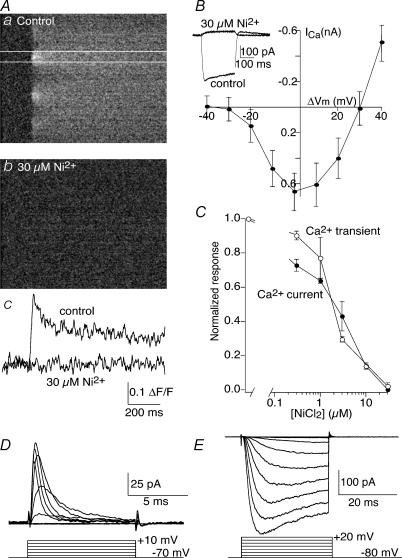
Figure 8. Ca2+ channels recorded with imaging and whole-cell patch recording are the same and are localized discretely on the axons.
A, Ca2+ transients recorded by imaging are blocked by Ni2+. Aa, line-scan image of an axonal Ca2+ response to a single action potential. Ca2+ transients imaged in this manner are localized to discreet regions on the axons. Ab, application of 30 μm Ni2+ abolishes these transients. Ac, the data between the white lines in a and b are replotted as a graph. B, whole-cell Ba2+ currents are high-voltage activated and blocked by Ni2+. The inset shows an example of a whole-cell Ba2+ current activated by depolarizing voltage step from −80 to 0 mV. Application of Ni2+ (30 μm) abolished this current. The graph shows the peak current recorded from a sequence of such current steps from −80 to +40 mV averaged from 10 axons. C, superimposed dose–response curves of the effect of Ni2+ on imaged Ca2+ transients (n = 4), and of whole-cell Ba2+ currents (n = 5). The curves demonstrate a very similar half-maximal inhibition of the responses by Ni2+ (2.5 and 2.0 μm, respectively). D, Na+ currents are readily recorded by cell attached recording of the axons. The electrode contained Ringer solution and 4-aminopyridine (4-AP) (1 mm; n = 5). E, similarly, K+ currents are readily recorded in cell-attached configuration. The electrode contained Ringer solution and TTX (1 μm; n = 6).

