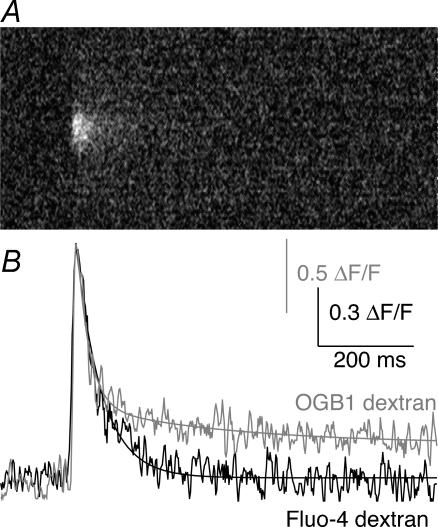
Figure 9. Comparison of evoked Ca2+ responses using Ca2+–sensitive dyes of different affinities.
Single-action-potential-evoked presynaptic Ca2+ transients were measured using Oregon Green 488 BAPTA-1 (OGB1; high affinity, kD 566 nm at 10°C) and Fluo-4 dextran (low affinity, kD 28 μm at 10°C). A, representative Ca2+ transient evoked by a single action potential recorded by Fluo-4 dextran. B, a comparison of the evoked responses measured with OGB1 and Fluo-4 dextran. The peak amplitudes are arbitrarily normalized to the same scale in this graph to emphasize the difference in kinetics of the decay rates. Because of its higher affinity, the OGB1 dextran can detect the late phase of the action-potential-evoked Ca2+ transient, and this response was best fit with two exponentials (τ= 25 and 700 ms). In contrast, only the early (hotspot) phase of the response is recorded with Fluo-4 dextran because the late-phase transient does not reach a concentration that makes a significant change in Fluo-4 dextran fluorescence. This decay is best fit with a signal exponential (τ= 52 ms).

