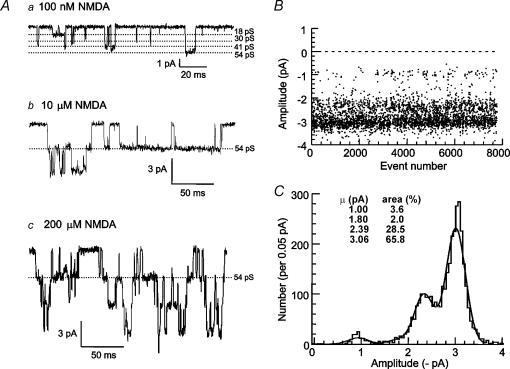
Figure 1. Large and small-conductance NMDA receptor channels in SNc dopaminergic neurones.
A, example currents recorded from outside-out patches from SNc dopaminergic neurones at a membrane potential of −60 mV in the presence of a, 100 nm NMDA and 10 μm glycine showing four different current amplitudes corresponding to the four conductance levels; b, 10 μm NMDA and 10 μm glycine; and c, 200 μm NMDA and 10 μm glycine. B, stability plot of channel amplitudes for one patch throughout the duration of the recording. C, amplitude distribution for the patch illustrated in B, fitted with the sum of four Gaussian components. The standard deviations were constrained to be the same (0.205 pA) for each component. The mean amplitude and relative area of each component are shown on the histogram, and correspond to chord conductances of 16.7 pS, 30.5 pS, 39.8 pS and 51.2 pS. The amplitude distribution contains current amplitudes for all openings that were longer than two filter rise-times.

