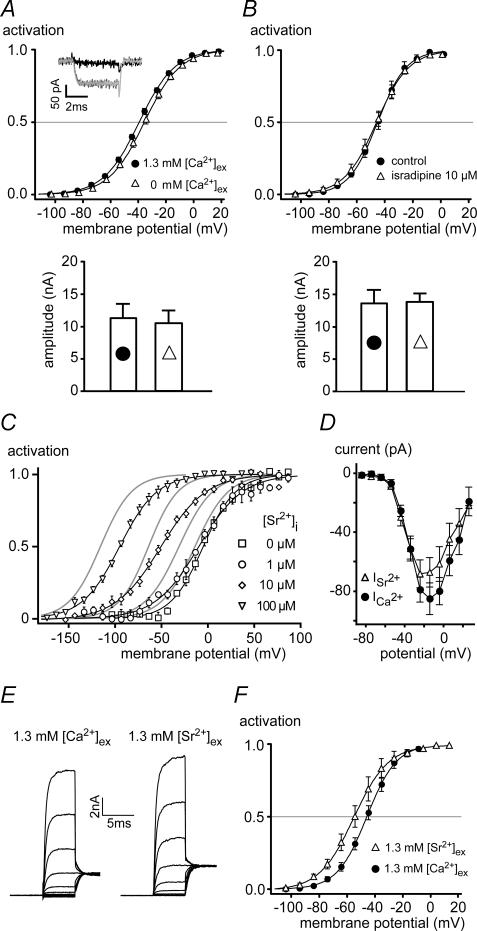
Figure 3. Ca2+ influx through Cav channels is not required for BKCa gating in IHCs.
A, upper panel shows steady-state activation curves of BKCa channels measured in whole-cell mode in rat IHCs before and after withdrawal of extracellular Ca2+ (5 mm extracellular BAPTA). Continuous lines show Boltzmann fits to the averaged data yielding Vh and α of −39.3 mV and 12.9 mV with 1.3 mm Ca2+, and −35.6 mV and 12.9 mV after withdrawal of extracellular Ca2+, respectively. Vh values were not significantly different (P = 0.45; Vh values of individual experiments were −39.0 ± 1.0 mV (1.3 mm Ca2+, n = 6) and −35.0 ± 2.0 mV (Ca2+-free, n = 6). Inset, the Ca2+-current in response to a step to −24 mV measured with a CsCl-based pipette solution was abolished by application of the Ca2+-free extracellular solution (dark grey, control; black, 0 [Ca2+]ex; light grey, wash). Lower panel shows that the absolute BKCa current amplitude was not changed by removal of extracellular Ca2+. Bars represent mean currents at −4 mV, where whole-cell activation was complete. B, upper panel show steady-state activation curves of BKCa channels measured in whole-cell mode in IHCs before and after block of Cav channels with isradipine (10 μm). Continuous lines show Boltzmann fits to the averaged data yielding Vh of −45.8 mV in the presence of isradipine (n = 7) and Vh of −45.1 mV in control conditions (n = 7). Slope factor α was 11.6 and 10.2 mV with and without isradipine, respectively. Vh values obtained from fits to individual experiments were not significantly different between both conditions (P = 0.20). Lower panel shows that current amplitude at −4 mV was not changed by application of isradipine. Currents in A and B (lower panels) were corrected for errors resulting from voltage drop across the residual series resistance (see Marcotti et al. 2004). C, BKCa currents measured in outside-out patches excised from IHCs were sensitive to [Sr2+]i. Steady-state activation curves at the [Sr2+]i indicated were obtained as in Fig. 2B and fitted with a Boltzmann function (continuous lines). At 0, 1, 10 and 100 μm[Sr2+]i, values for Vh and α of BKCa activation were −5.5 mV and 17.6 mV (n = 4), −10.2 mV and 23.6 mV (n = 3), −51.4 mV and 24.6 mV (n = 4) and −95.6 mV and 20.3 mV (n = 3), respectively. Activation curves obtained with 0, 1, 3 and 10 μm[Ca2+]i are shown for comparison (grey lines). Note that Sr2+ was about 10-fold less effective than Ca2+. D, inward currents through Cav channels measured in whole-cell mode with extracellular solutions containing either 1.3 mm Ca2+ (n = 5 IHCs) or 1.3 mm Sr2+ (n = 4). Currents were recorded upon depolarizing voltage steps from a holding potential of −84 mV. CsCl-based pipette solution was used and extracellular solution contained 35 mm TEA to block all K+ currents. E, whole-cell BKCa currents measured from the same IHC either at 1.3 mm[Ca2+]ex (left-hand panel) or 1.3 mm[Sr2+]ex (right-hand panel). Voltage protocol as in Fig. 1C. F, steady-state activation of BKCa channels determined from six experiments as in E. Lines are results of Boltzmann fits yielding values for Vh and α of −55.1 mV and 12.4 mV for 1.3 mm[Sr2+]ex, and −45.8 mV and 10.6 mV for 1.3 mm[Ca2+]ex, respectively.

