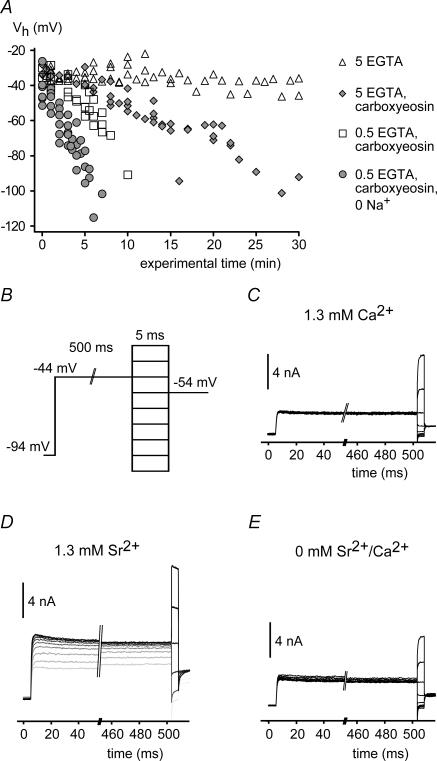
Figure 4. BKCa channels in intact IHCs are sensitive to a global increase in [Ca2+]i.
A, activation of BKCa currents measured in whole-cell mode in IHCs under various conditions interfering with Ca2+ extrusion. Vh values were obtained from Boltzmann fits to the activation curves obtained as in Fig. 1C and plotted against the time after establishment of whole-cell access. Vh remained constant under control conditions (▵; n = 6 IHCs) but shifted to more negative potentials when 50 μm carboxy-eosin was included in the pipette solution (  ; n1= 5). Reduction of the intracellular Ca2+ buffer EGTA to 0.5 mm (□; n = 5) and replacement of external Na+ by NMDG+ (•; n = 6) further accelerated the leftward shift. Symbols show pooled data for each condition. Cells usually deteriorated when reaching a Vh of around −100 mV, precluding the observation of the BKCa activation curve beyond this value. B, voltage protocol for measuring BKCa currents with a depolarizing prepulse to −44 mV to allow for a prolonged inward current through Cav channels prior to each 5-ms test voltage step in nominal 10-mV increments. Intervals between successive sweeps were 55 ms. C, BKCa current response to the voltage protocol in B under control conditions with 1.3 mm[Ca2+]ex. D, BKCa current response from the same cell as in C after replacement of Ca2+ by Sr2+. Note that the amplitude of the BKCa current increased during the prepulse with each voltage step. Consequently, currents during the short test voltage step were larger and were activated already at more negative potentials. The first sweep is shown in light grey; subsequent sweeps are shown in increasingly darker grey. E, BKCa current response as in C after removal of extracellular Sr2+.

