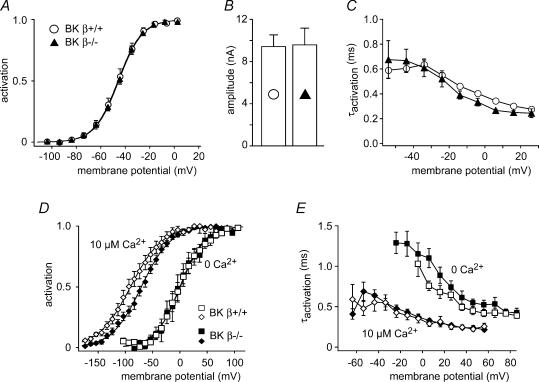
Figure 6. BKCa gating in IHCs is not affected by KCNMB1.
A, steady-state BKCa activation curves determined from whole-cell recordings in IHCs of wild-type (○; n = 7) and BKβ1−/− mice (▴; n = 9). Lines represent results of Boltzmann fits to the averaged data yielding values for Vh and α of −45.5 mV and 9.7 mV for BKβ1−/− IHCs and −46.0 mV and 9.7 mV for wild-type IHCs, respectively. B, BKCa current amplitudes measured at −4 mV from the same IHCs as in A (symbols as in A). Currents were corrected for the voltage drop across the residual series resistance as in Fig. 3A and B. C, the time constants of activation, obtained from monoexponential fits to the rising phase of the same current data from A and B are very similar in BKβ1−/− and control IHCs (symbols as in A). D, BKCa activation measured in outside-out patches from wild-type and BKβ1−/− mice at 0 and 10 μm free [Ca2+]i as in Fig. 2. Data are mean values of five and 14 patches for wild-type and eight and 16 patches for the BKβ1−/− IHCs. Lines represent results of a Boltzmann fit to the averaged data yielding values for Vh and α of −0.3 mV and 22.54 mV (wild-type at 0 Ca2+), 0.6 mV and 23.0 mV (BKβ1−/− at 0 Ca2+), −90.8 mV and 29.5 mV (wild-type at 10 μm 0 Ca2+) and −70.7 mV and 27.2 mV (BKβ1−/− at 10 μm Ca2+), respectively. E, activation time constants from the BKCa currents in D were essentially equal in BKβ1−/− and control patches, with only a slightly slower activation in BKβ1−/− at 0 Ca2+. Time constants were obtained from monoexponential fits to the onset of the currents.

