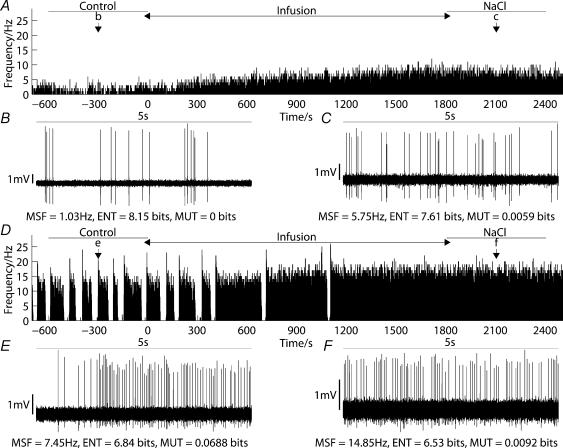
Figure 1. Continuous and phasic cells respond differently to osmotic stimulation in vivo.
A, shows a ratemeter record, with a 1-s bin width, of a continuous cell during a 30-min infusion of 1 m NaCl at a rate of 52 μl min−1. B and C, show 5-s excerpts taken from A at the times indicated, before (Control) and after (NaCl) hypertonic infusion. Values for mean spike frequency (MSF), log interval entropy (ENT) and mutual information (MUT) are included. Although the firing rate for the continuous cell was greater in C than B, the interval variability was smaller. D–F, show equivalent plots for a phasic cell recorded before, during and after a similar infusion, illustrating an increase in mean spike frequency, a small decrease in entropy and a substantial decrease in mutual information.

