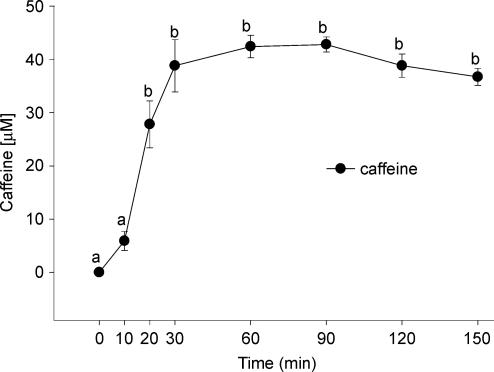
Figure 1. Plasma caffeine concentrations.
Results are shown during both the 30 min pre-clamp period (t = 0–30 min) and during the 120 min isoglycaemic–hyperinsulinaemic clamp (t = 30–150 min) following the ingestion of caffeine capsules (dose = 5 mg kg−1). Time points not sharing a lower case letter are significantly different from each other. Values are means ±s.e.m.

