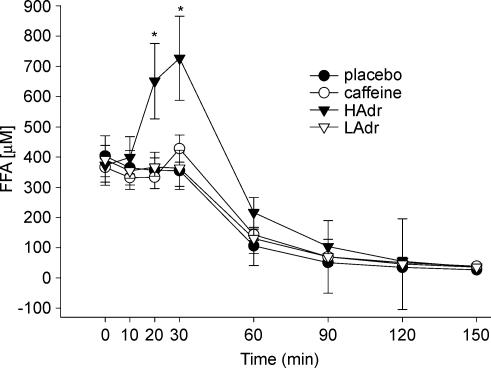
Figure 5. Plasma FFA concentrations.
Results are given for the placebo (•), caffeine (○), HAdr (▾) and LAdr (▵) trials during both the 30 min pre-clamp period (t = 0–30 min) and during the 120 min isoglycaemic–hyperinsulinaemic clamp (t = 30–150 min). HAdr resulted in higher FFA concentrations compared with all other treatments, as indicated by the asterisks. Values are means ±s.e.m.

