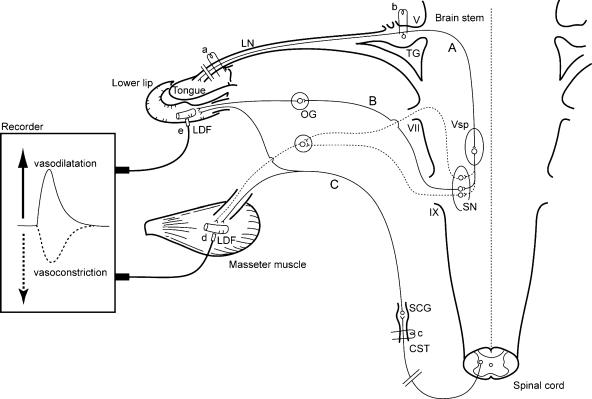
Figure 1. Schematic representation of the sites of electrical stimulation and blood flow measurements in the rats.
Stimulation sites: central cut end of the lingual nerve (LN) (a), trigeminal ganglion (TG) (b), and peripheral cut end of superior cervical sympathetic trunk (CST) (c). Blood flow measurement sites: masseter muscle (d) and lower lip (e) by laser-Doppler flowmeter (LDF). The continuous lines indicate trigeminal sensory inputs to the brain stem (A), the parasympathetic vasodilator fibres to the lower lip from the salivatory nuclei (SN) (B) (Kaji et al. 1991), and the sympathetic vasoconstrictor fibres to both masseter muscle and lower lip from the CST (C). The dashed lines indicate the possible pathways by which nerve excitation may evoke vasodilatation in the masseter muscle in response to LN stimulation. OG, otic ganglion; SCG, superior cervical ganglion; Vsp, trigeminal spinal nucleus; V, trigeminal nerve root; VII, facial nerve root; and IX, glossopharyngeal nerve root.

