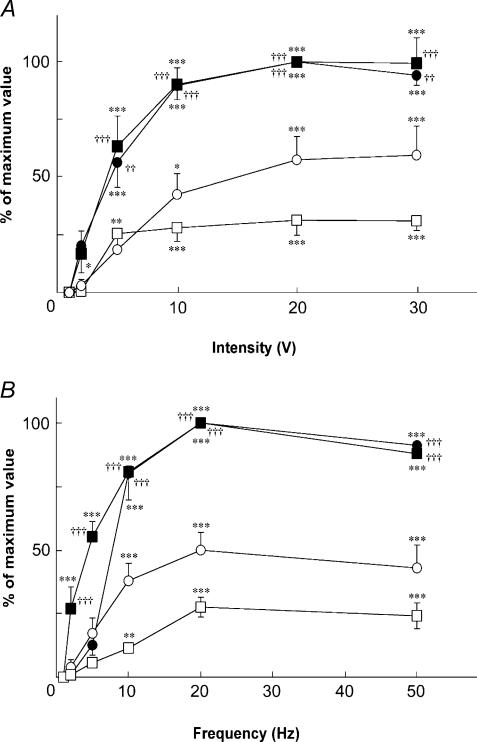
Figure 3. Stimulus intensity– and frequency–response relationships for the changes in the MBF and LBF evoked by LN stimulation.
Stimulation was at various intensities (1–30 V) and various frequencies (1–50 Hz). The intensity– (A) and frequency– (B) response curves of the left (ipsilateral, filled symbols) and right (contralateral, open symbols) sides in the masseter muscle (• and ○, n = 6 in each group) and the lower lip (▪ and □, n = 6 in each group) were generated using stimulus trains for the left LN at 20 Hz and at 20 V, respectively. Maximal increases in both the MBF and LBF in response to LN stimulation were taken as 100%. Each value is given as the mean ± s.e.m. The statistical significance of the differences was assessed by ANOVA followed by a post hoc test (Fisher's PLSD). *P < 0.05, **P < 0.01, ***P < 0.001 versus basal value (at intensity of 1 V and at frequency of 1 Hz). ††P < 0.01, †††P < 0.001, significant differences between the increases in blood flow recorded by LN stimulation on the left side and right side (ANOVA followed by a contrast test).

