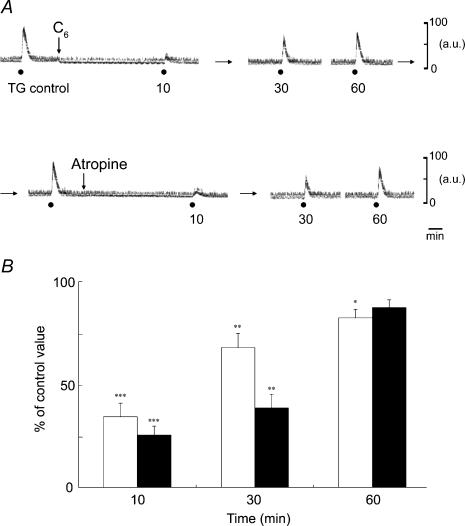
Figure 7. Effects of pharmacological agents on the increases in MBF on the left (ipsilateral) side evoked by electrical stimulation of the left TG.
A, typical examples of the effects of the intravenous administration of C6 (10 mg kg−1) and Atr (100 μg kg−1) on the MBF increases evoked by TG stimulation (•) for 20 s with 20 V at 20 Hz using 2 ms pulses. B, the MBF increases evoked by TG stimulation 10, 30 and 60 min after administration of C6 (white bars, n = 4 in each group) and Atr (black bars, n = 3 in each group) are expressed as a percentage of the pretreatment response and given as means ± s.e.m. The statistical significance of the differences in this pretreatment response (control) was assessed by ANOVA followed by a post hoc test (Fisher's PLSD) (*P < 0.05, **P < 0.01, ***P < 0.001).

