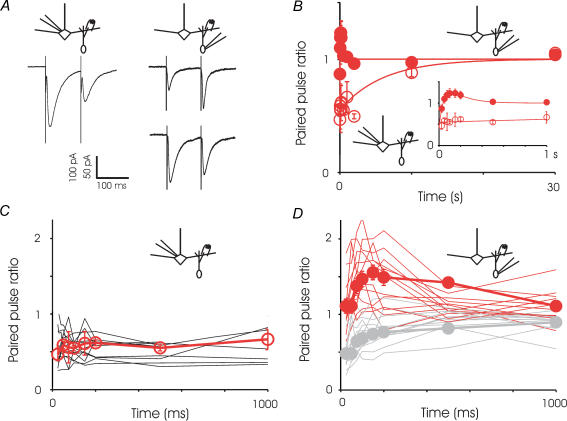
Figure 4. Paired-pulse modulation.
A, right, sample recordings from a mitral cell showing paired-pulse depression at 100 ms interval (average of 16 trials). Left, sample recordings from two granule cells, one showing facilitation at 100 ms interval (average of 13 trials) and one showing depression at this same interstimulus interval (average of 16 trials). B, summary of paired pulse experiments for the two sides of reciprocal synapse showing an average of all cells. The GC-to-MC synapse exhibits marked paired-pulse depression at all intervals examined and the data could be described by a single exponential with a time constant of about 6 s. In contrast, the MC-to-GC synapse shows a combination of depression and facilitation. The fitted line is a sum of two exponentials – one for depression with a time constant of 45 ms and one for facilitation with a time constant of 150 ms. Icons indicate the direction of the synapse studied. For GC-to-MC synapses, each point represents 6–14 cells; for MC-to-GC synapses, reach point represents 7–24 cells. Inset, a close-up of intervals up to 1 s, showing the region of greatest contrast between the two sides of the synapse. Up to intervals of 1 s, for each time point, the data for MC are different from GC at P < 0.05. C, traces showing the recording of the GC-to-MC current at various interpulse intervals in individual mitral cells. The average of all cells is superimposed. D, traces showing the recording of the MC-to-GC current at various interpulse intervals in individual granule cells. The average of facilitating cells is superimposed in red, and of depressing cells in light grey.

