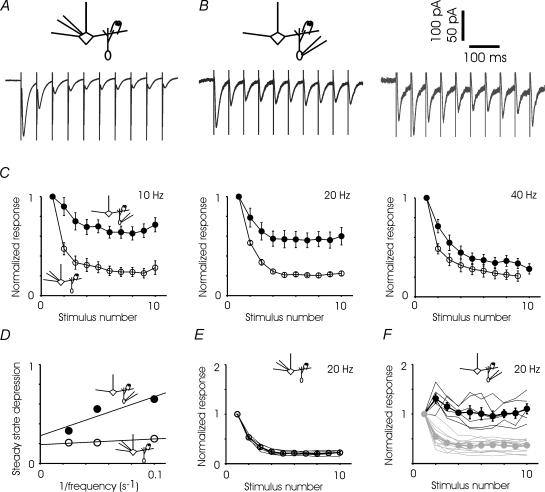
Figure 5. Responses to stimulus trains.
A, sample average GC-to-MC synaptic response to 20 Hz stimulation; response is depressed to 20% of original within three pulses and remains stable for the next six. B, sample average MC-to-GC traces showing progressive depression in one cell and an initial facilitation followed by depression in another cell. C, summary of all experiments indicates substantially less depression in the MC-to-GC synapse when compared to GC-to-MC synapse at lower, but not higher, stimulus frequencies. All sets of data are fitted with single exponentials (τ of around 1 stimulus). 10 Hz: GC-to-MC n = 14 cells, MC-to-GC n = 9 cells, highly significantly different at stimulus numbers 2 through 10; 20 Hz: GC-to-MC n = 5, MC-to-GC n = 19, significantly different at stimulus numbers 4 through 10; 40 Hz, GC-to-MC n = 8, MC-to-GC n = 14, significantly different at stimulus number 2 only (Student's t test, significant P < 0.05, highly significant P < 0.01). D, steady state value of MC-to-GC and GC-to-MC currents are plotted as a function of the inverse of the stimulus frequency (1/f). Best-fitting straight lines are also shown. E, responses of the GC-to-MC currents during 20 Hz stimulation are relatively homogeneous. Individual mitral cells are shown by continuous lines and the average of all cells is shown by circles. F, responses of the MC-to-GC excitatory currents during 20 Hz are heterogeneous. Individual granule cell responses are shown by the continuous lines, with depressing cells in light grey. The averages of facilitating and depressing cells are also shown separately. Facilitating cells are significantly different from depressing cells at stimulus numbers 2 through 10 (Student's t test, P < 0.05).

