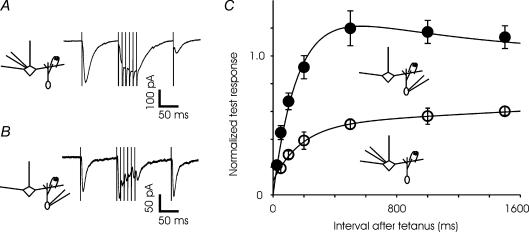
Figure 6. Different time course of recovery from depression at the two sides of the reciprocal synapse.
A, synaptic currents recorded in a mitral cell in response to a single stimulus followed by 6 stimuli at 100 Hz and finally a test pulse at a variable interval (100 ms, in the trace shown) after the cessation of train (average of 12 trials). B, synaptic response to a similar stimulus in a granule cell (average of 5 trials). C, summary of all experiments indicates a dramatic difference in the recovery time course between the two sides of the synapse. The fitted curve for GC-to-MC synapse has two time constants – about 160 ms for recovery from depression and 1000 ms for facilitation. For the MC-to-GC curve, two time constants for depression (180 and 7000 ms) were used. For each time point, the data for MC are different from GC at P < 0.05. For GC-to-MC synapse, N = 4 cells and for MC-to-GC synapse, N = 18 cells.

