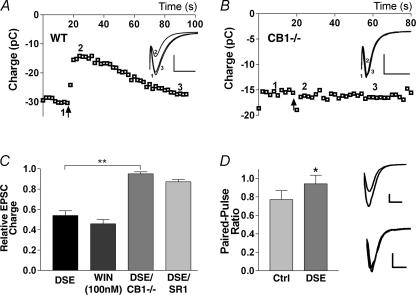
Figure 1. Glutamatergic autaptic hippocampal neurones exhibit DSE.
A shows the time course of EPSCs (integral, in pC) recorded before and after depolarizing stimulus (10 s, indicated by arrow) in wild-type (WT) mice. Inset shows relevant traces from time points 1–3 indicated in the main graph (scale bars: 1 nA and 15 ms). B, similar recordings performed in cultures from mice lacking the CB1 receptor. Inset as in A. C, comparison of average inhibitions by DSE stimulus in wild-type neurones, WIN 55212-2 (WIN; 100 nm), DSE stimulus in CB1–/– neurones, and in the presence of the CB1 antagonist SR 141716A (SR1; 100 nm). D, left panel shows comparison of paired-pulse ratios before and after DSE stimulus. Right panel shows representative traces (scale bars: 500 pA and 10 ms). *P < 0.05 by Student's paired t test; **P < 0.001 by one-way ANOVA with Tukey's post hoc test.

