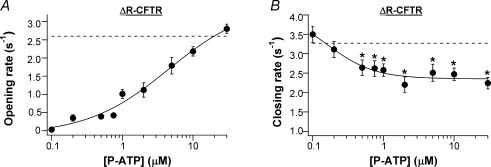
Figure 4. Single-channel kinetic parameters of ΔR-CFTR in the presence of P-ATP.
The dose–response relationship between P-ATP and the opening rate (A) or the closing rate (B). Continuous lines are Hill equation fits to the data. The n values for the fits are 0.75 ± 0.30 for the opening rates, and 1.30 ± 0.90 for the closing rates. The dashed line in A shows the maximal opening rate in the presence of saturating [ATP] (2.6 ± 0.2 s−1, n = 20). The dashed line in B shows the mean closing rate at various [ATP] (3.3 ± 0.1 s−1, n = 8) (data from Bompadre et al. 2005a). *P < 0.05 compared with the closing rate at 0.1 μm P-ATP.

