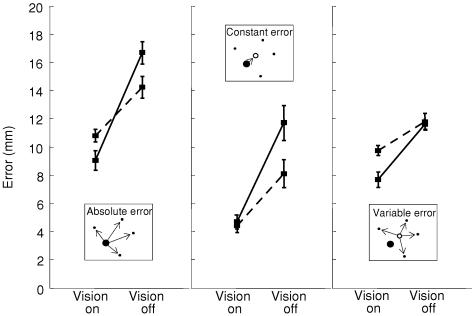
Figure 2. Foot placement error.
The inset graphics show the three methods of error measurement. The filled circle shows the target, dots show example endpoints of footprint centroids, and the open circle shows the mean endpoint position. Dashed lines show fast steps, continuous lines show slow steps.

