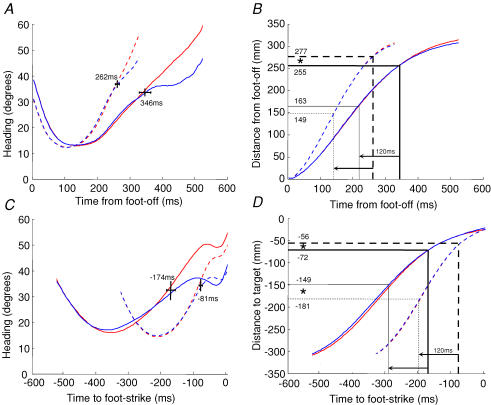
Figure 4. Heading of the foot towards the target.
Heading of the hallux marker with respect to the target was averaged with respect to foot-off (A). Dashed lines show fast steps, continuous lines show slow steps. Thick lines show vision-on traces and thin lines show vision-off traces. The temporal point at which these traces deviate is shown by the short vertical line, with horizontal lines representing standard errors. Thick grid lines in the corresponding distance–time plot (B) show the equivalent separation points in space. Thin grid lines show the spatial points 120 ms earlier in time, to account for reaction time. C and D show the equivalent plots for heading averaged with respect to foot-strike. *Significant differences between distances (P < 0.05).

