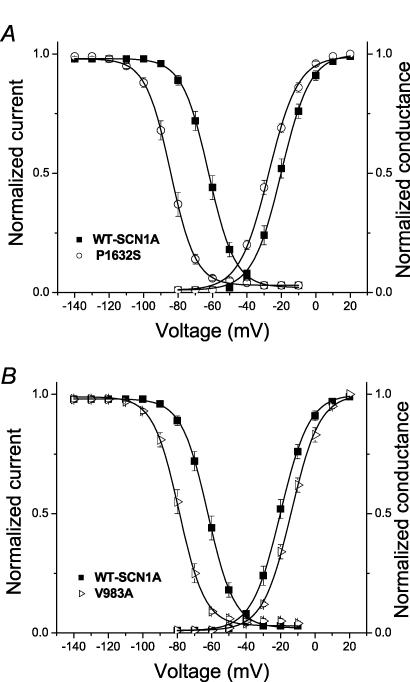
Figure 4. Altered voltage dependence of activation and inactivation.
A, plots of steady-state inactivation and conduction–voltage curves for WT-SCN1A (▪) and P1632S (○). B, similar plots for WT-SCN1A (▪) and V983A (⊳). Data are the same as shown in Fig. 3B and C, with fit parameters given in Table 1.

