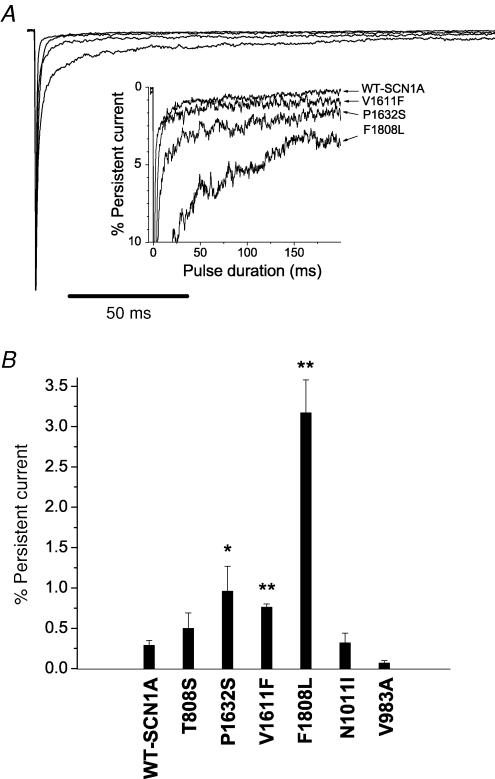
Figure 6. ICEGTC mutants exhibit persistent sodium current.
A, sodium current was measured at the end of a 200 ms depolarization to −10 mV from a holding potential of −120 mV. TTX-sensitive currents were obtained by digital subtraction of sodium currents recorded before and after TTX addition. Sodium currents were normalized to peak amplitude. The inset shows an expanded vertical scaled to emphasize the relative proportion of persistent current. B, persistent sodium current expressed as the percentage of peak current amplitude for WT-SCN1A (n = 9) and the six ICEGTC mutants (n = 4–6). Values significantly different from WT are indicated as *P < 0.05 and **P < 0.005.

