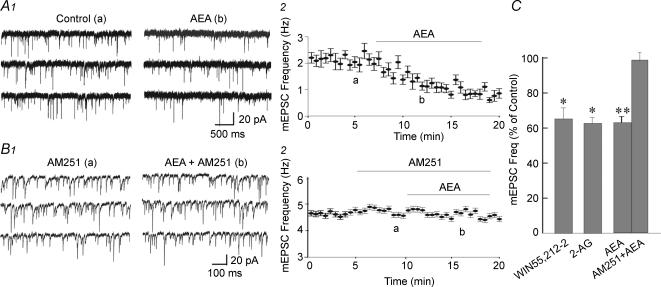
Figure 1. Effect of cannabinoids on glutamate release.
A, sample traces (1) and a running average plot of mEPSC frequency (2) from a SON magnocellular neurone showing an AEA-mediated decrease in mEPSC frequency. B, sample traces (1) and a running average plot of mEPSC frequency (2) from another magnocellular neurone showing that the CB1 receptor antagonist AM251 (1 μm) blocked the AEA-induced suppression of mEPSCs. Letter designations a and b in the running average plots correspond to traces denoted by a and b; all data points in the running average plots represent a mean ± s.e.m. of 30 s of continuous events. C, mean changes in the average mEPSC frequencies caused by the synthetic cannabinoid WIN55,212-2 (1 μm, n = 8) and the endogenous cannabinoids 2-AG (0.5–1 μm, n = 5) and AEA (0.5 μm, n = 5). The AEA effect on mEPSC frequency was blocked by AM251 (1 μm, n = 4). *P < 0.05; *P < 0.01.

