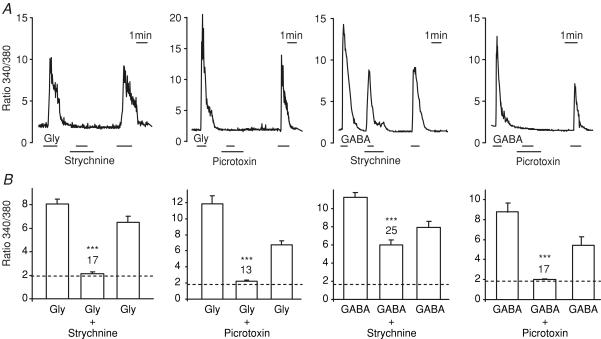
Figure 5. Intracellular Ca2+ responses to glycine and GABA.
A, intracellular [Ca2+] was monitored as the ratio of fluorescence at 340 and 380 nm in fura-2-loaded GLUTag cells. Glycine (0.1 mm), GABA (1 mm), strychnine (10 μm) and picrotoxin (100 μm) were added as indicated by the horizontal bars. B, mean peak fluorescence ratio (averaged over 5 s) of cells recorded as in A. Bars indicate the mean response to glycine or GABA before addition of the toxin, in the presence of toxin, and following toxin washout. The dashed line represents the background fluorescence ratio in the absence of test agent, and the numbers of cells measured are indicated above the bars. Statistical significance was tested by comparing the ratio in the presence of the toxin with the mean of the responses before and after the toxin application, using Student's paired t test; ***P < 0.001.

