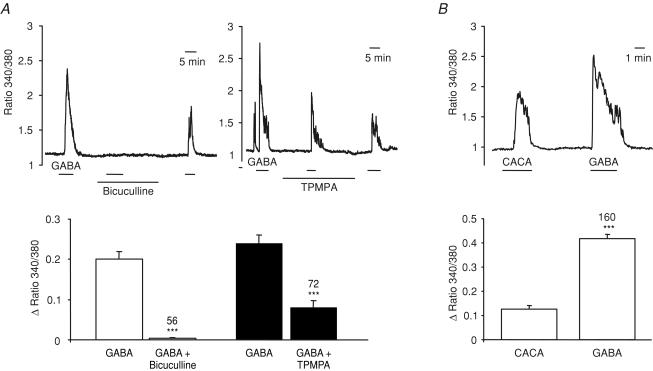
Figure 6. Pharmacological characterization of the GABA-triggered Ca2+ responses.
Intracellular [Ca2+] was monitored as the ratio of fluorescence at 340 and 380 nm in fura-2-loaded GLUTag cells. A, top, responses to GABA (100 μm) in the absence and presence of bicuculline methiodide (100 μm) and (1,2,5,6-tetrahydropyridine-4-yl)methylphosphinic acid (TPMPA) (100 μm), as indicated by the horizontal bars; bottom, mean change in the fluorescence ratio (averaged over 150 s) of cells recorded as above during the application of GABA before addition and after washout of the antagonist or in the presence of the antagonist. The numbers of cells measured (in three independent experiments each) are indicated above the bars. Statistical significance was tested by comparing the ratio change in the presence of the antagonist with the mean of the responses before and after the antagonist application, using Student's paired t test; ***P < 0.001. B, top, responses to cis-4-aminocrotonic acid (CACA) (100 μm) and GABA (100 μm) applied as indicated by the horizontal bars in an example cell; bottom, mean change in the fluorescence ratio (averaged over 150 s) of cells recorded as above. The numbers of cells measured (in five independent experiments) are indicated above the bars. Statistical significance was tested by comparing the ratio changes triggered by CACA and GABA in the same cell, using Student's paired t test; ***P < 0.001.

