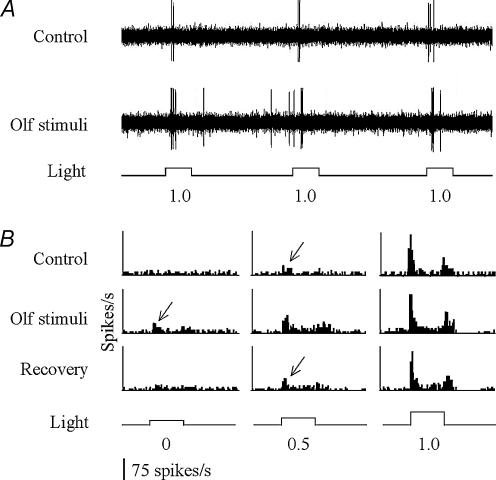
Figure 2. Single-unit retinal ganglion cell (RGC) responses recorded before and after olfactory stimulation.
A, representative RGC responses recorded from a single RGC fibre in the optic nerve. The stimulus light intensity was approximately 1 log unit above the RGC threshold level as determined before olfactory stimulation (designated 1.0). After olfactory stimulation, the number of spikes (both spontaneous and light-evoked) increased in response to the same light stimulation. B, histograms of light-evoked RGC responses before (top) and during (middle) olfactory stimulation, and after 5 min of recovery (bottom). Threshold RGC responses are indicated by arrows. Note that the threshold intensity that was required to evoke RGC responses decreased after olfactory stimulation. After 5 min of recovery, the threshold returned to the control level. The intensity of the light stimuli (at the bottom of the histograms) increased by 0.5 log-unit steps (from left to right), starting below or near threshold level (designated 0).

