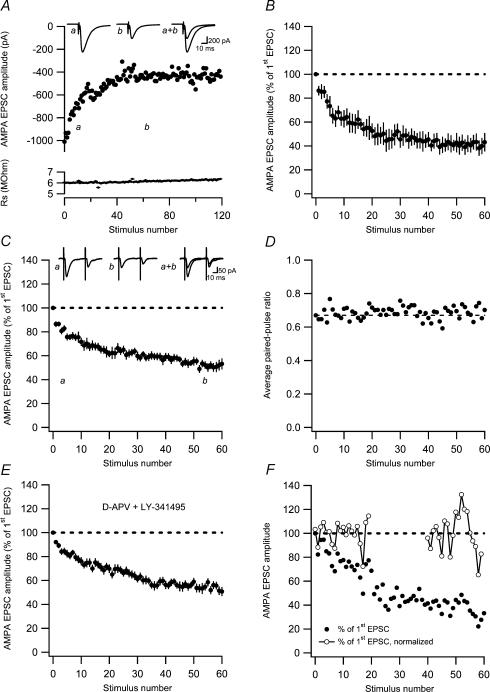
Figure 1. AMPA EPSC fatigue at previously unstimulated (naive) developing PP–GC synapses.
A, an experiment illustrating AMPA EPSC fatigue at 0.2-Hz stimulation at −80 mV. Measurements of series resistance are plotted versus stimulus number in the lower graph. Average EPSCs (n = 10) taken at time points a and b are shown as insets. B, AMPA EPSC fatigue in response to single stimulation at 0.2 Hz (n = 7) as a function of stimulus number. Before averaging, the EPSCs in each experiment were normalized with respect to the very first evoked EPSC. C, average AMPA EPSC fatigue in response to paired-pulse stimulation (50 ms) at 0.2 Hz as a function of stimulus number (n = 10). Representative average EPSCs (n = 10) taken at time points a and b are shown as insets. D, average paired-pulse ratio during synaptic fatigue plotted as a function of stimulus number. The paired-pulse ratio measurements were constructed as ratios between average (n = 10 experiments) second and first EPSCs. Dashed line indicates the paired-pulse ratio of the first stimulus. E, AMPA EPSC fatigue in the presence of the NMDA receptor antagonist D-AP5 (50 μm) and the mGlu receptor antagonist LY-341495 (20 μm; n = 16). AMPA EPSCs were evoked by single stimulation at 0.2 Hz. F, AMPA EPSC variability during synaptic fatigue. An experiment illustrating AMPA EPSC fatigue at 0.2-Hz stimulation at −80 mV. AMPA EPSC amplitudes are normalized with respect to the very first evoked EPSC (•). EPSC amplitudes are also shown normalized with respect to the average EPSC amplitude during the first 20 sweeps and during sweep 40–60 (○–○). Note that the variability increases towards the end of the fatigue protocol.

