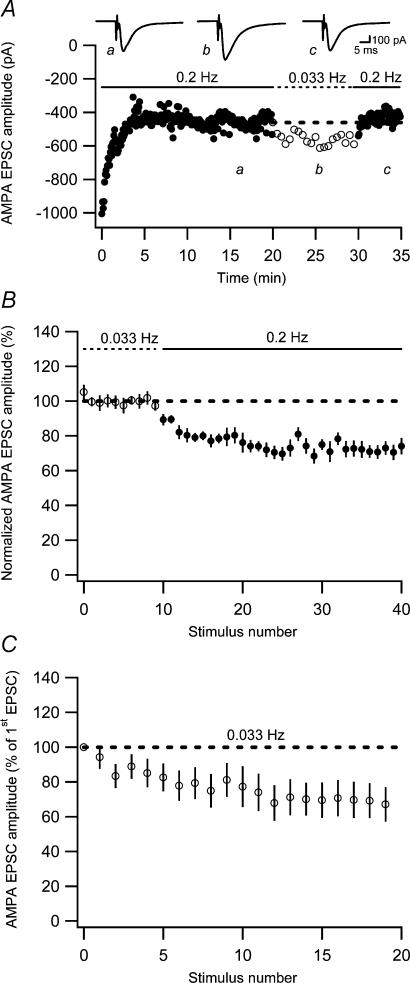
Figure 2. Two components of AMPA EPSC fatigue.
A, an experiment illustrating an initial AMPA EPSC fatigue, followed by a reversible increase in AMPA EPSC amplitude when switching the stimulation frequency from 0.2 to 0.033 Hz. Average EPSCs (n = 10) at the different stimulation frequencies are shown as insets. Dashed line represents average AMPA EPSC amplitude just before switching to 0.033 Hz. B, graph showing decrease of AMPA EPSC when switching from 0.033 to 0.2 Hz (n = 8). C, average AMPA EPSC fatigue in response to stimulation at 0.033 Hz as a function of stimulus number (n = 12).

