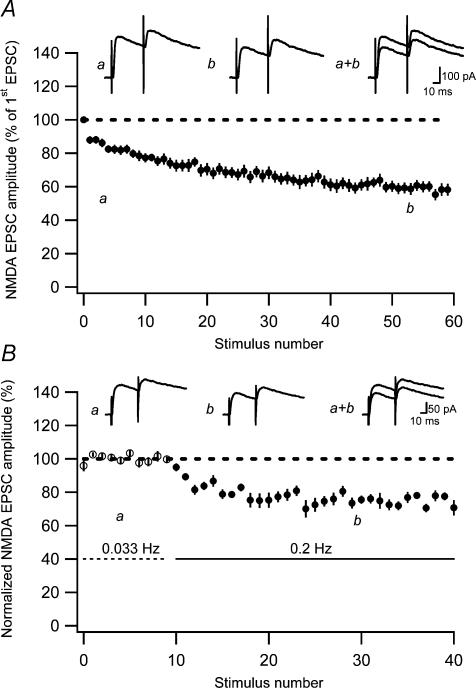
Figure 4. NMDA EPSC fatigue at previously unstimulated (naive) developing PP–GC synapses.
A, average NMDA EPSC fatigue in response to both single and paired-pulse stimulation (50 ms) at 0.2 Hz as a function of stimulus number (n = 16). Representative average EPSCs (n = 10) taken at the beginning (a) and the end (b) of the fatigue protocol are shown on top. B, low-frequency depression of NMDA EPSCs. Graph shows average (n = 6) decrease of NMDA EPSCs when switching from 0.033 to 0.2 Hz. Before averaging, the EPSCs in each experiment were normalized with respect to the average EPSC amplitude evoked at 0.033 Hz. Representative average EPSCs (n = 10) taken at time points indicated by a and b are shown on top.

