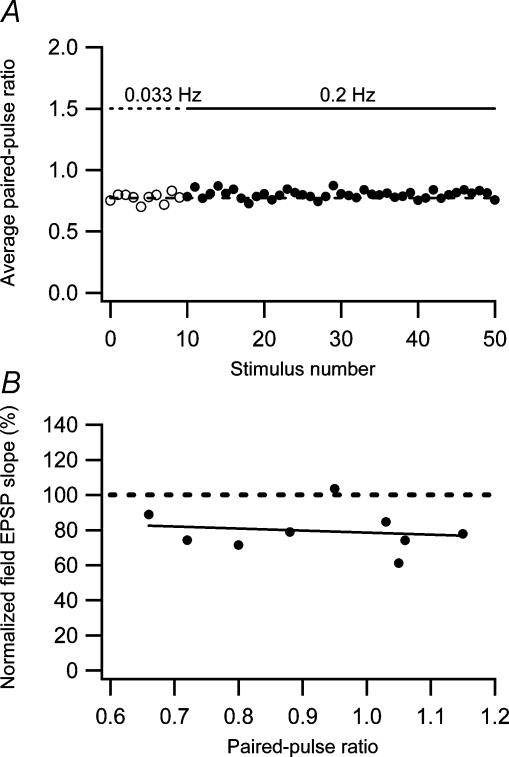
Figure 8. Relationship between low-frequency depression and paired-pulse plasticity.
A, there is no change in paired-pulse ratio in association with low-frequency depression. Average paired-pulse ratio during low-frequency depression is plotted as a function of stimulus number. The paired-pulse ratio measurements were constructed as ratios between average (n = 19 experiments) second and first EPSCs. The dashed line is an average of the first 10 measurements evoked at 0.033 Hz. B, low-frequency depression is not correlated with paired-pulse plasticity. The amount of low-frequency depression measured using field EPSPs is plotted against the paired-pulse ratio (n = 9). The dashed line represents a linear regression through the data points (r=−0.16, P > 0.05).

