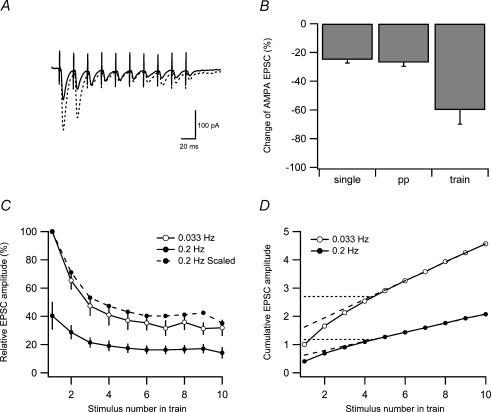
Figure 9. Estimation of vesicle pool size during low-frequency depression.
A, examples of average (n = 10) responses to 10-impulse 50-Hz stimulation trains evoked at 0.033 Hz (dashed line) and at 0.2 Hz (continuous line). B, bar graph showing the average change of the AMPA EPSC when using single (n = 10), paired-pulse (PP) (n = 19) and train (n = 7) stimulation. C, average AMPA EPSC amplitudes in response to 10-impulse 50-Hz stimulation trains evoked at 0.033 Hz (○) and at 0.2 Hz (•). AMPA EPSC amplitudes are plotted versus stimulus number in the 50-Hz train and they were normalized to the first EPSC in the train evoked at 0.033 Hz before averaging. Filled circles connected by dashed line is the same as filled circles connected with continuous line, but scaled such that the first EPSC amplitude in the train is 100%. D, cumulative AMPA EPSC amplitude during 50-Hz train stimulation based on the EPSC amplitudes in C. Dashed lines are extrapolations from linear regression over the last five data points. Intersection between dashed line and the y-axis represents a lower-limit estimation of the pool size. Dotted lines are the horizontal extrapolation from the point where the linear regression line and the cumulative amplitude curve deviate. Intersection between dotted line and the y-axis represents an upper-limit estimation of the pool size.

