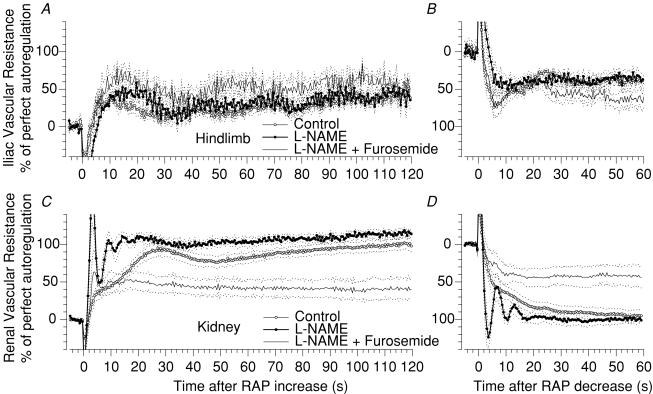
Figure 3. Step responses of hindlimb and renal blood flow autoregulation. Influence of NO and TGF.
Time course of the autoregulatory response of vascular resistance in response to a step increase (A and C) and a step decrease (B and D) of arterial pressure in the hindlimb (A and B) and in the kidney (C and D). Responses during control (○), during NOS inhibition by l-NAME (•) and during additional TGF inhibition by furosemide (lines without circles). Mean (continuous lines) ± s.e.m. (dashed lines), n = 5.

