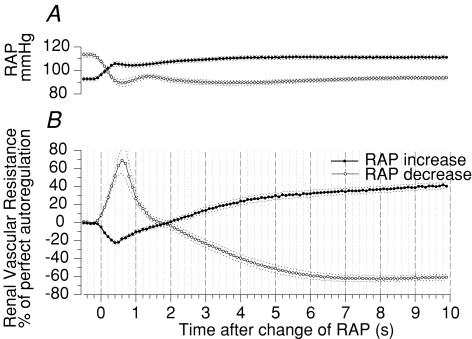
Figure 5. Comparison of the dynamics of the myogenic response to a step increase and step decrease of renal artery pressure (RAP).
Time course of RAP (A) and of the autoregulatory response of renal vascular resistance (B) during the initial 10 s after step increase (•) and step decrease (○) of RAP, averaged from the control periods of all rats. Mean ± s.e.m., n = 23.

