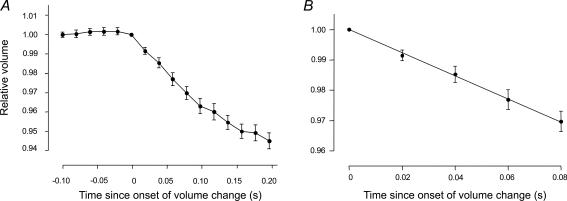
Figure 4. Calculation of mean fractional filtration rate (Jv(f)).
A, for each individual glomerulus, glomerular volume is normalized to that at the onset of the shrink phase of filtration, and time is normalized to the onset of the shrink phase of filtration. Relative glomerular volume can then be plotted against time for a population of glomeruli exposed to the same experimental conditions. B, a linear regression line is applied to the change in relative volume that occurs in the first 0.08 s after the onset of the shrink phase of glomerular filtration. The magnitude of the slope of this line (−0.38 ± 0.01 s−1) describes the mean filtration rate for this representative control population (n = 10).

