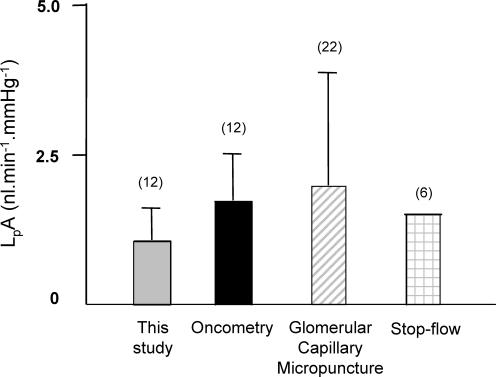
Figure 11. Comparison of ultrafiltration coefficient (LpA) values obtained in the current study with those reported in the literature for Wistar rats.
LpA values from this report (grey bar) have been compared with the results of this paper, but analysed according to Savin's ‘greatest difference’ method (black bar; see Discussion; Savin & Terreros, 1981), with results from direct glomerular micropuncture studies (hatched bar; see Methods; Aukland et al. 1977), and with results from stop-flow studies (Arendshorst & Gottschalk, 1974). Numbers in parentheses represent number of animals studied. Error bars represent standard deviation (where reported). LpA values were similar to those published in the literature.

