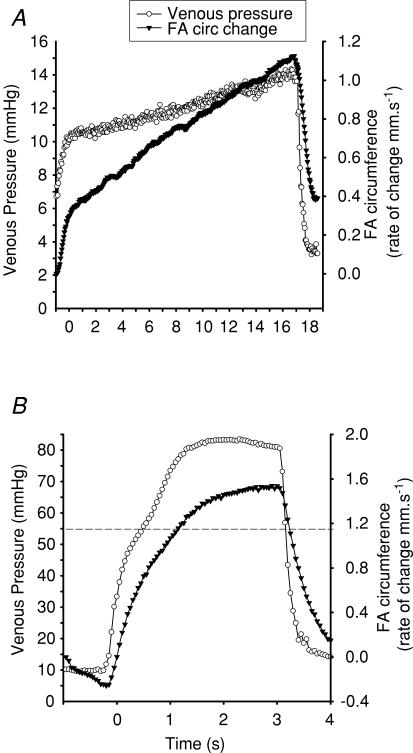
Figure 2. Typical forearm circumference change and venous pressure.
Venous blood pressure (○, primary y-axis) and simultaneous rate of change in forearm (FA) circumference (▾, secondary y-axis), used to calculated forearm blood flow at rest (A) and at fatigue (B). Dashed line represents the venous cut-off pressure of 55 mmHg, at which point the flow measurement was discontinued. Note plateau effects above 55 mmHg.

