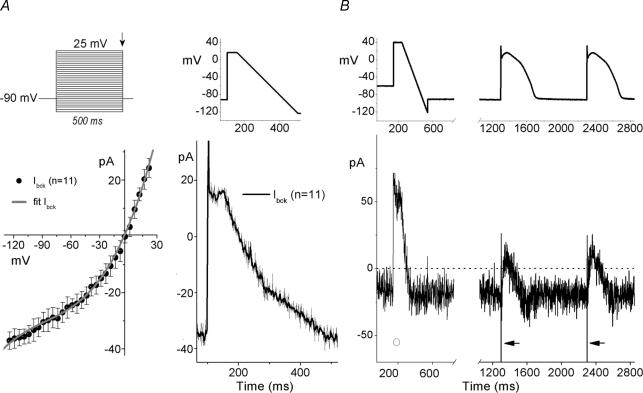
Figure 2. Square wave-, step-ramp-, and AP-elicited currents in HEK-293 cells.
A, Ibck in non-transfected HEK cells. Upper left panel depicts the voltage-step protocol; lower left panel shows the corresponding Ibck–V, determined from amplitudes at the end of the 500-ms voltage steps (arrow). The fit (continuous line) is a third-order polynomial equation (see text for details). A step-ramp waveform (upper right panel) was used to determine time-course of averaged Ibck (lower right panel). B, step-ramp and ‘subepicardial’-type AP-waveforms (top) to activate Ibck (bottom) in a WT SCN5A cDNA-transfected HEK cell (representative examples). Note the absence (○) and the presence (arrows) of fast INa, as a function of Vhold of −60 mV and −90 mV, respectively (see text for details). APs were generated using the PB model cell; broken line shows zero current level; peak INa is off scale.

