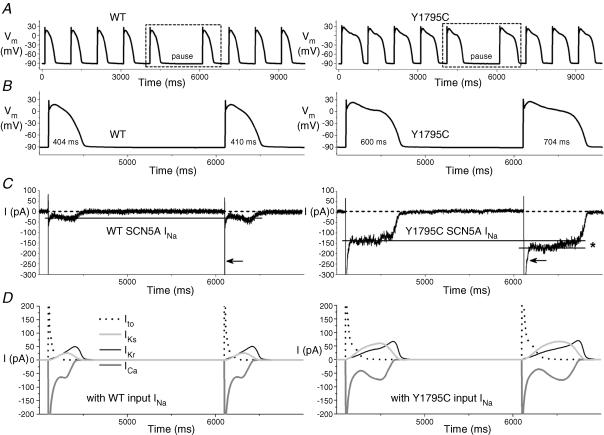
Figure 5. Dynamic action potential clamp with WT or Y1795C INa.
A, subepicardial cell APs elicited at 1 Hz before and after a 2 s pause. APs with mutant INa are prolonged compared to WT (see Table 1). B, boxed APs from A and associated INa in C, on expanded time scale. HEK cell INas were scaled to identical peak amplitudes (21 nA), and applied to the ‘subepicardial’ PB model cell as an external current input. Note that late INa-increase after the pause is more pronounced with the mutant (*). Broken line shows zero current level; peak INa is off scale; note the slower time-course of peak INa-inactivation of the mutant compared to the WT (arrows). D, relationship between the APs from B and selected membrane current components of the PB model cell, showing the changes in the time-course of transient outward K+ current (Ito), slowly and rapidly activating components of the delayed rectifier K+ current (IKs and IKr, respectively), and L-type Ca2+ current (ICa), along with changes in mutant INa.

