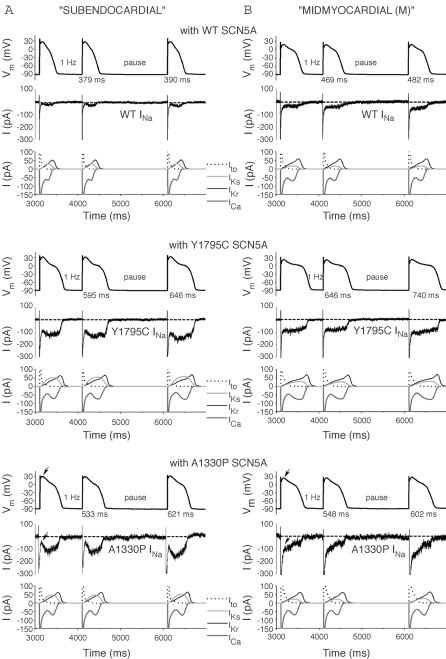
Figure 9. AP prolongation caused by the Y1795C and A1330P mutations in ‘subendocardial’ (A) and ‘M’ (B) cells.
Representative APs (top) at 1 Hz, the corresponding HEK cell INa (middle), and associated individual membrane currents in the PB model cell (bottom). AP prolongation was exaggerated in subendocardial and M cells compared to subepicardial cells. The same input (WT, Y1795C, or A1330P) INa peak amplitude was used in A and B, respectively. Arrows in bottom panels indicate plateau amplitude and the corresponding late INa amplitude.

