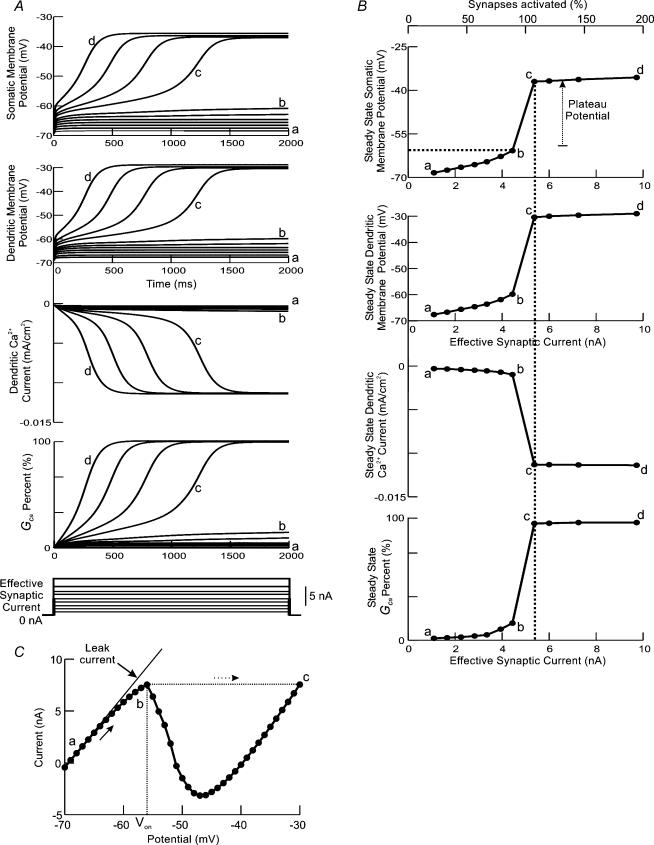
Figure 2. Direct measurements from the soma and a dendritic compartment during spike blockage at different levels of synaptic excitation.
A, simultaneous measurements from the model of the somatic (upper graph) and dendritic (2nd graph) membrane potentials, dendritic Ca2+ persistent inward current (PIC) (3rd graph), and overall Cav1.3 channel conductance (GCa) (lower graph) at different levels of synaptic excitation. Traces show the responses for 14–200% in an ascending order of level of synaptic excitation (14%, 27%, 40%, 53%, 65%, 77%, 89%, 110%, 125%, 150% and 200%). The letters a, b, c and d show the responses at 14%, 89%, 110% and 200% of synaptic excitation, respectively. B, steady-state responses, measured at the end of a 2 s period of synaptic excitation in the traces shown in A, are plotted as a function of synaptic excitation level. The top axis shows the percentage of activated synapses at each level. Vertical dashed line shows the current level at which plateau potentials were triggered by synaptic excitation, which is equal to 5.4 nA. Horizontal dashed line shows the voltage threshold at which plateau potentials were triggered by graded synaptic excitation alone, which is equal to –60 mV. C, steady-state I–V relationship at the soma with a NSR created by the Ca2+ PIC. Thin continuous line shows the leak current. Vertical dashed line shows the 1st zero-slope point, or the onset potential (Von) of the Ca2+ PIC. Solid arrow shows the direction of change in somatic current for an increasing level of membrane potential. Dashed arrow shows the jump in membrane potential to cross the NSR.

