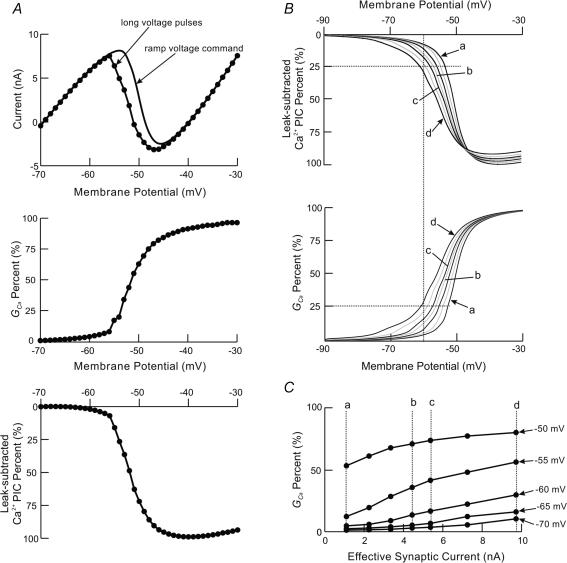
Figure 3. Measurements from the soma under voltage-clamp conditions for different levels of synaptic excitation.
A, comparison of I–V relationships (upper graph) obtained by using a ramp voltage command (continuous line) and long voltage pulses (filled circles) with no synaptic activation. GCa (middle graph) and leak-subtracted Ca2+ PIC (lower graph) normalized to their peak values measured during long voltage pulses. B, leak-subtracted Ca2+ PIC (upper graph) and GCa (lower graph) normalized to their peak values measured from the model during the ascending phase of the ramp voltage-clamp command at different levels of synaptic excitation. The horizontal and vertical dashed lines show the graded decrease in the PIC somatic activation threshold and graded increase in the amplitude of Ca2+ PIC, respectively, as more synapses are activated. a, b, c and d are as defined in Fig. 2A. C, the change in magnitude of GCa with respect to synaptic current at different membrane potentials (–50 to –70 mV) under voltage-clamp conditions in B.

