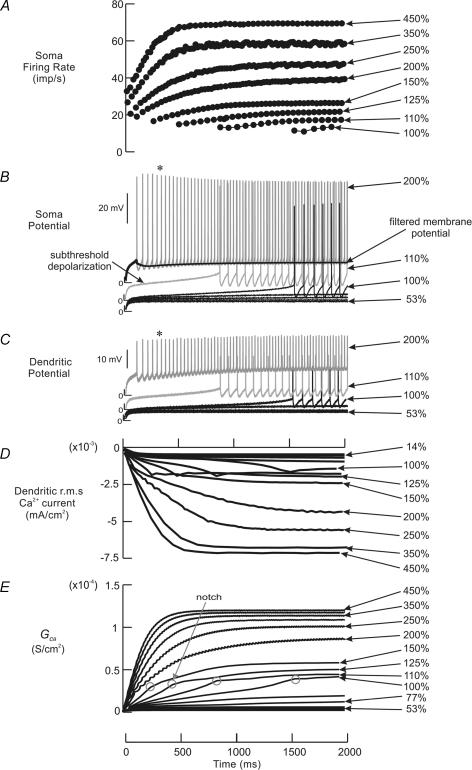
Figure 4. Measurements from the soma and a dendritic compartment during cell firing at different levels of synaptic excitation.
For each level of synaptic excitation, the recordings show the soma firing rate (impulses s−1; A), soma spikes (B), dendritic spikes measured from a dendritic compartment located at 695.9 μm (0.52 λ) from the soma (C), dendritic root mean square Ca2+ current measured from the same dendritic compartment (D), GCa (E). * Traces are shifted up for clearer display and avoidance of overlap. Grey circles (notches) show the abrupt change in GCa upon firing onset. Thick black line in B shows the filtered somatic membrane potential during cell firing.

